
Page 190 - EXIM-Bank_Annual-Report-2023
P. 190
EXIM BANk MALAySIA
188 A Vision to Serve Empowering Growth Management Discussion and Analysis
ANNUAL REPORT 2023
Notes to the fiNaNcial statemeNts
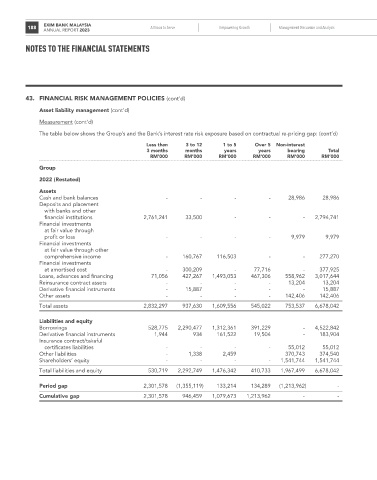
43. FINANCIAL rISk MANAGEMENT PoLICIES (cont’d)
Asset liability management (cont’d)
Measurement (cont’d)
The table below shows the Group’s and the Bank’s interest rate risk exposure based on contractual re-pricing gap: (cont’d)
Less than 3 to 12 1 to 5 over 5 Non-interest
3 months months years years bearing Total
rM’000 rM’000 rM’000 rM’000 rM’000 rM’000
Group
2022 (Restated)
Assets
Cash and bank balances - - - - 28,986 28,986
Deposits and placement
with banks and other
financial institutions 2,761,241 33,500 - - - 2,794,741
Financial investments
at fair value through
profit or loss - - - - 9,979 9,979
Financial investments
at fair value through other
comprehensive income - 160,767 116,503 - - 277,270
Financial investments
at amortised cost - 300,209 - 77,716 - 377,925
Loans, advances and financing 71,056 427,267 1,493,053 467,306 558,962 3,017,644
Reinsurance contract assets - - - - 13,204 13,204
Derivative financial instruments - 15,887 - - - 15,887
Other assets - - - - 142,406 142,406
Total assets 2,832,297 937,630 1,609,556 545,022 753,537 6,678,042
Liabilities and equity
Borrowings 528,775 2,290,477 1,312,361 391,229 - 4,522,842
Derivative financial instruments 1,944 934 161,522 19,504 - 183,904
Insurance contract/takaful
certificates liabilities - - - - 55,012 55,012
Other liabilities - 1,338 2,459 370,743 374,540
Shareholders’ equity - - - - 1,541,744 1,541,744
Total liabilities and equity 530,719 2,292,749 1,476,342 410,733 1,967,499 6,678,042
Period gap 2,301,578 (1,355,119) 133,214 134,289 (1,213,962) -
Cumulative gap 2,301,578 946,459 1,079,673 1,213,962 - -