
Page 211 - EXIM-Bank_Annual-Report-2022
P. 211
A VISION COMMITMENT EMPOWERING ENSURING ENHANCING FINANCIAL
TO SERVE TO LEAD GROWTH SUSTAINABILITY GOVERNANCE STATEMENTS 209
Notes to the fiNaNcial statemeNts
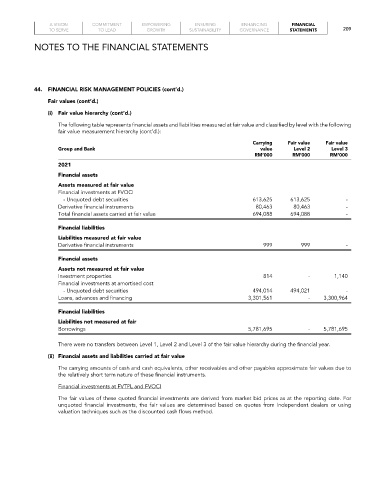
44. FINaNCIaL RISk MaNaGEMENT POLICIES (cont’d.)
Fair values (cont’d.)
(i) Fair value hierarchy (cont’d.)
The following table represents financial assets and liabilities measured at fair value and classified by level with the following
fair value measurement hierarchy (cont’d.):
Carrying Fair value Fair value
Group and Bank value Level 2 Level 3
rM’000 rM’000 rM’000
2021
Financial assets
Assets measured at fair value
Financial investments at FVOCI
- Unquoted debt securities 613,625 613,625 -
Derivative financial instruments 80,463 80,463 -
Total financial assets carried at fair value 694,088 694,088 -
Financial liabilities
Liabilities measured at fair value
Derivative financial instruments 999 999 -
Financial assets
Assets not measured at fair value
Investment properties 814 - 1,140
Financial investments at amortised cost
- Unquoted debt securities 494,014 494,021 -
Loans, advances and financing 3,301,561 - 3,300,964
Financial liabilities
Liabilities not measured at fair
Borrowings 5,781,695 - 5,781,695
There were no transfers between Level 1, Level 2 and Level 3 of the fair value hierarchy during the financial year.
(ii) Financial assets and liabilities carried at fair value
The carrying amounts of cash and cash equivalents, other receivables and other payables approximate fair values due to
the relatively short term nature of these financial instruments.
Financial investments at FVTPL and FVOCI
The fair values of these quoted financial investments are derived from market bid prices as at the reporting date. For
unquoted financial investments, the fair values are determined based on quotes from independent dealers or using
valuation techniques such as the discounted cash flows method.