
Page 188 - EXIM-Bank_Annual-Report-2022
P. 188
186 eXIM BANK MALAYsIA ANNUAL REPORT 2022
Notes to the fiNaNcial statemeNts
44. FINaNCIaL RISk MaNaGEMENT POLICIES (cont’d.)
Liquidity risk management (cont’d.)
Measurement
Liquidity is measured by the Group’s and the Bank’s ability to efficiently and economically accommodate decrease in deposits/
funding (such as funds obtained from the Government) and other purchased liabilities and to fund increases in assets to ensure
continued growth of the Group and the Bank.
The Group and the Bank maintain large capital base, sufficient liquid assets, diversified funding sources, and regularly assesses
the long-standing relationship with traditional fund providers. These processes are subject to regular reviews to ensure
adequacy and appropriateness.
In addition, the Group’s and the Bank’s liquidity positions are monitored and managed through structural liquidity indicators,
such as loan to purchase funds and offshore revolving funds utilisation rate ratios to maintain an optimal funding mix and asset
composition.
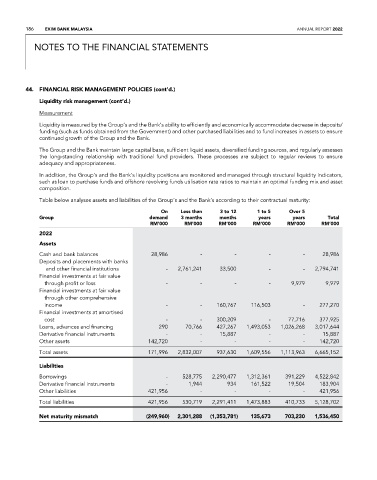
Table below analyses assets and liabilities of the Group’s and the Bank’s according to their contractual maturity:
On Less than 3 to 12 1 to 5 Over 5
Group demand 3 months months years years total
rM’000 rM’000 rM’000 rM’000 rM’000 rM’000
2022
Assets
Cash and bank balances 28,986 - - - - 28,986
Deposits and placements with banks
and other financial institutions - 2,761,241 33,500 - - 2,794,741
Financial investments at fair value
through profit or loss - - - - 9,979 9,979
Financial investments at fair value
through other comprehensive
income - - 160,767 116,503 - 277,270
Financial investments at amortised
cost - - 300,209 - 77,716 377,925
Loans, advances and financing 290 70,766 427,267 1,493,053 1,026,268 3,017,644
Derivative financial instruments - - 15,887 - - 15,887
Other assets 142,720 - - - - 142,720
Total assets 171,996 2,832,007 937,630 1,609,556 1,113,963 6,665,152
Liabilities
Borrowings - 528,775 2,290,477 1,312,361 391,229 4,522,842
Derivative financial instruments - 1,944 934 161,522 19,504 183,904
Other liabilities 421,956 - - - - 421,956
Total liabilities 421,956 530,719 2,291,411 1,473,883 410,733 5,128,702
Net maturity mismatch (249,960) 2,301,288 (1,353,781) 135,673 703,230 1,536,450